
Dashboard software is a tool that turns business data into visual, shareable, and actionable reports for monitoring KPIs, trends, and performance in one place.
21 best dashboard software tools in 2026 at a glance
Below is a quick comparison of the best dashboard software options for 2026, including core capabilities, pricing approach, ideal team size, deployment model, and where each platform stands out most.
| Tool | Core Features | Pricing Approach | Ideal Team Size | Deployment Model | Standout Strength |
|---|---|---|---|---|---|
| FineBI | Self-service BI, drag-and-drop dashboards, data integration, governed analytics, mobile dashboards | Custom quote | SMB to enterprise | Cloud / on-premises | Strong balance of ease of use and enterprise governance |
| Microsoft Power BI | Data modeling, interactive dashboards, Microsoft integrations, AI features, embedded analytics | Free + per-user + capacity-based | SMB to enterprise | Cloud / desktop / embedded | Best fit for Microsoft-centric organizations |
| Tableau | Advanced visual analytics, data exploration, storytelling, enterprise deployment | Per-user pricing | Mid-market to enterprise | Cloud / on-premises | Leading visual exploration and analytics flexibility |
| Looker Studio | Marketing dashboards, Google connectors, report sharing, lightweight dashboards | Free + enterprise add-ons via ecosystem | Small to mid-size teams | Cloud | Fast reporting for Google ecosystem users |
| Looker | Semantic modeling, governed BI, embedded analytics, cloud warehouse integration | Custom quote | Mid-market to enterprise | Cloud | Strong governance for data-mature teams |
| Qlik Sense | Associative analytics, self-service dashboards, AI insights, governed analytics | Per-user / capacity-based | Mid-market to enterprise | Cloud / on-premises | Flexible exploration across complex datasets |
| Metabase | Open-source BI, SQL and no-code querying, embedded analytics, dashboards | Free open-source + paid tiers | Startup to mid-market | Cloud / self-hosted | Accessible open-source reporting |
| Apache Superset | Open-source dashboards, SQL-first exploration, custom visualization ecosystem | Free open-source | Technical teams | Self-hosted | Highly customizable for engineering-led teams |
| Domo | Cloud BI, real-time dashboards, app ecosystem, collaboration | Custom quote | Mid-market to enterprise | Cloud | Strong operational dashboards and data apps |
| Klipfolio | KPI dashboards, business metrics tracking, cloud connectors, client reporting | Subscription tiers | Small teams to agencies | Cloud | Good fit for agencies and SMB KPI tracking |
| Geckoboard | Live KPI dashboards, TV dashboards, alerts, simple sharing | Subscription tiers | Small to mid-size teams | Cloud | Excellent for wallboards and team visibility |
| Sisense | Embedded analytics, data fusion, white-label dashboards, scalable architecture | Custom quote | Mid-market to enterprise | Cloud / hybrid | Strong embedded analytics capabilities |
| Zoho Analytics | Self-service reporting, AI assistant, data prep, business app integrations | Tiered subscription | Small to mid-size teams | Cloud / on-premises | Cost-effective for growing businesses |
| Databox | KPI scorecards, marketing and sales dashboards, mobile access, templates | Subscription tiers | Small businesses to agencies | Cloud | Fast setup for go-to-market teams |
| Grafana | Monitoring dashboards, observability, real-time metrics, alerts | Free open-source + paid cloud | Technical teams to enterprise | Cloud / self-hosted | Best for infrastructure and operational monitoring |
| ThoughtSpot | Search-based analytics, AI insights, self-service dashboards | Custom quote | Mid-market to enterprise | Cloud | Natural-language analytics experience |
| Sigma | Spreadsheet-like BI, cloud warehouse analytics, collaboration | Per-user pricing | Mid-market to enterprise | Cloud | Familiar interface for business teams |
| Mode | SQL analytics, notebooks, dashboards, collaboration | Custom quote | Data teams | Cloud | Strong for analyst-led reporting workflows |
| Redash | Query editor, lightweight dashboards, alerts, open-source simplicity | Free open-source + hosted options | Small technical teams | Cloud / self-hosted | Simple SQL dashboarding |
| AgencyAnalytics | Marketing dashboards, SEO/PPC reporting, client portals | Subscription tiers | Agencies | Cloud | Tailored for client-facing marketing reporting |
| Kibana | Elasticsearch dashboards, log analytics, observability visualizations | Free + enterprise Elastic tiers | Technical teams to enterprise | Cloud / self-hosted | Best for Elasticsearch-based analytics |
Shortlist highlights of Dashboard Software
If you want to narrow the field quickly, these are the strongest picks by common buying scenario:
- Best overall dashboard software for mixed business teams: FineBI
- Best for Microsoft environments: Microsoft Power BI
- Best for advanced visual analytics: Tableau
- Best for Google marketing reporting: Looker Studio
- Best open-source dashboard software: Metabase
- Best for embedded analytics: Sisense
- Best for startups and lean teams: Zoho Analytics or Metabase
- Best for TV dashboards and KPI visibility: Geckoboard
- Best for technical monitoring: Grafana
- Best for agencies: AgencyAnalytics or Klipfolio
Who each tool is best for
- Startups: Metabase, Zoho Analytics, Databox
- Small businesses: FineBI, Zoho Analytics, Klipfolio, Looker Studio
- Agencies: AgencyAnalytics, Klipfolio, Databox, Looker Studio
- Ecommerce brands: FineBI, Power BI, Tableau, Domo
- Enterprise analytics teams: Tableau, Power BI, Looker, Qlik Sense, Sisense
- Product and engineering teams: Metabase, Superset, Grafana, Mode
- Organizations needing governed self-service BI: FineBI, Looker, Power BI
How to choose the right dashboard software
Choosing dashboard software is less about finding the most feature-heavy tool and more about matching the platform to your reporting model, user base, and data complexity.
Use the checklist below before you book demos or start trials.
Practical checklist for selecting dashboard software
- Define reporting goals
- Are you tracking executive KPIs, operational metrics, marketing performance, or cross-functional business health?
- List your data sources
- CRM, ERP, spreadsheets, ad platforms, databases, cloud warehouses, ecommerce systems, help desk tools
- Identify user roles
- Executives, analysts, managers, external clients, frontline teams, embedded product users
- Set refresh requirements
- Real-time, hourly, daily, weekly
- Assess ease of use
- Can non-technical users create or filter dashboards without depending on analysts?
- Review customization
- Can you tailor layouts, metrics, branding, permissions, and drill-down paths?
- Check integrations
- Native connectors reduce implementation friction and maintenance effort
- Evaluate collaboration
- Sharing links, subscriptions, comments, alerts, exports, presentations, embedding
- Verify security and governance
- Row-level security, role-based permissions, auditability, SSO, compliance support
- Estimate total cost
- Include licenses, implementation, admin time, consulting, training, and infrastructure
- Test scalability
- Can the tool support more dashboards, more users, and more data volume over time?
- Review vendor support
- Onboarding help, training resources, SLA, documentation, partner ecosystem
What small companies should prioritize
Small companies usually get more value from dashboard software that is easy to deploy and easy to maintain than from platforms built for large BI departments.
Prioritize the following:
- Affordable pricing with transparent entry-level plans or flexible deployment
- Simple setup without a long data modeling project
- Ready-made connectors for popular tools like Google Analytics, Shopify, HubSpot, Salesforce, and spreadsheets
- Low maintenance needs so dashboards stay useful without a dedicated admin team
- Easy sharing for managers and non-technical users
- Scalability so the tool still fits once reporting needs grow
For many growing businesses, FineBI is a strong option here because it combines self-service dashboard creation with stronger governance than lightweight reporting tools, making it suitable for teams that want to scale without replacing their platform too early.
Buyer's guide criteria for comparing tools
When comparing dashboard software, use consistent criteria across every product review and vendor demo.
1. Visualization quality
Ask whether the tool supports:
- Clear and modern chart types
- Drill-down and interactive filtering
- Mobile-friendly layouts
- Presentation-ready dashboards
- Flexible design without needing heavy coding
2. Self-service analytics
Look for:
- Drag-and-drop report building
- Natural-language or assisted query features
- Reusable metrics
- User-friendly filtering and exploration
- Guardrails for non-technical users
3. Governance and security
Important areas include:
- Role-based access control
- Row-level security
- Centralized metric definitions
- Certified datasets
- SSO and audit logs
4. Embedded analytics
If dashboards need to appear inside your product, portal, or customer experience, ask about:
- Embedding methods
- White-labeling
- Tenant isolation
- API support
- Performance at scale
5. Mobile access and collaboration
Check for:
- Native mobile apps or responsive dashboards
- Scheduled reports
- Alerts and threshold notifications
- Shared workspaces
- PDF, slide, and spreadsheet exports
Questions to ask during demos and trials
- How long does the average implementation take?
- Which connectors are native versus partner-built?
- How are semantic models or governed metrics handled?
- What happens when user count doubles?
- How are permissions managed for executives, departments, and external users?
- Can business users build dashboards without SQL?
- How does the platform handle large datasets and refresh performance?
- What support is included during onboarding?
In-depth reviews of the best dashboard software platforms
1. FineBI
One-sentence overview: FineBI is self-service dashboard software that combines drag-and-drop reporting, broad data connectivity, and governed analytics for teams that need both usability and scale.
 Key Features:
- Drag-and-drop dashboard creation
- Self-service analytics for business users
- Centralized data management and governance
- Multiple data source integration
- Interactive dashboards and mobile access
- Flexible deployment options
Pros & Cons:
- Pros:
- Easier adoption for non-technical users than many enterprise BI tools
- Strong balance between self-service and control
- Suitable for both operational and management dashboards
- Good fit for growing organizations that want to avoid outgrowing lightweight tools too quickly
- Cons:
- Brand awareness may be lower than Power BI or Tableau in some markets
- Advanced evaluation may require a tailored demo to map specific use cases
Best For (Target user/scenario):
- Businesses needing governed self-service dashboard software
- Teams that want to serve both analysts and business users
- Organizations looking for a scalable alternative to fragmented spreadsheet reporting
Pricing considerations:
- Best evaluated through a custom quote based on deployment model, user count, and business requirements
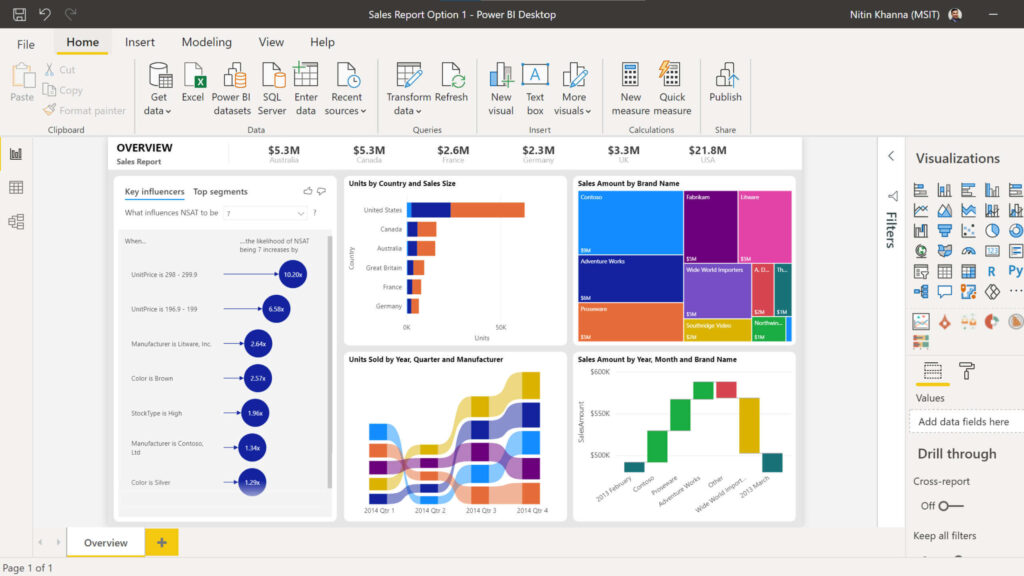
2. Microsoft Power BI
One-sentence overview: Microsoft Power BI is enterprise-ready dashboard software that combines strong visualization, broad data connectivity, and deep integration with Microsoft 365, Azure, and Teams.
 Key Features:
- Interactive dashboards and reports
- Power Query for data transformation
- DAX-based modeling and calculations
- Excel, Teams, Azure, and Microsoft Fabric integration
- Embedded analytics and mobile apps
- AI-assisted insights and natural-language queries
Pros & Cons:
- Pros:
- Strong value for organizations already using Microsoft tools
- Scales from individual analysts to enterprise deployments
- Large connector ecosystem
- Good balance of self-service and governance
- Cons:
- DAX has a learning curve
- Interface can feel fragmented across Desktop, Service, and Fabric layers
- Best experience often depends on broader Microsoft stack adoption
Best For (Target user/scenario):
- Organizations standardized on Microsoft 365 or Azure
- Finance, operations, and enterprise reporting teams
- Companies needing embedded analytics and governed BI
Pricing considerations:
- Entry-level access is relatively affordable, but enterprise sharing and capacity costs can rise with scale
3. Tableau
One-sentence overview: Tableau is a leading dashboard software platform for teams that prioritize advanced visual analytics, deep exploration, and polished presentation-quality dashboards.
 Key Features:
- Rich chart library and highly interactive dashboards
- Strong data exploration and drill-down workflows
- Tableau Prep for data preparation
- Broad data connectivity
- Storytelling and presentation features
- Enterprise governance options
Pros & Cons:
- Pros:
- Excellent visual flexibility
- Strong choice for analyst-led exploration
- Mature enterprise deployment capabilities
- Widely adopted across large organizations
- Cons:
- Licensing can be expensive
- Can require skilled developers or analysts for advanced builds
- Governance is not always as centralized as more model-driven tools
Best For (Target user/scenario):
- Enterprise BI teams
- Organizations with mature analytics functions
- Teams building executive dashboards and exploratory analysis side by side
Pricing considerations:
- Generally better suited to mid-market and enterprise budgets than cost-sensitive startups
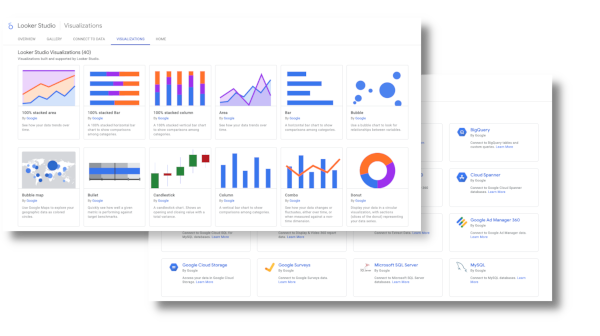
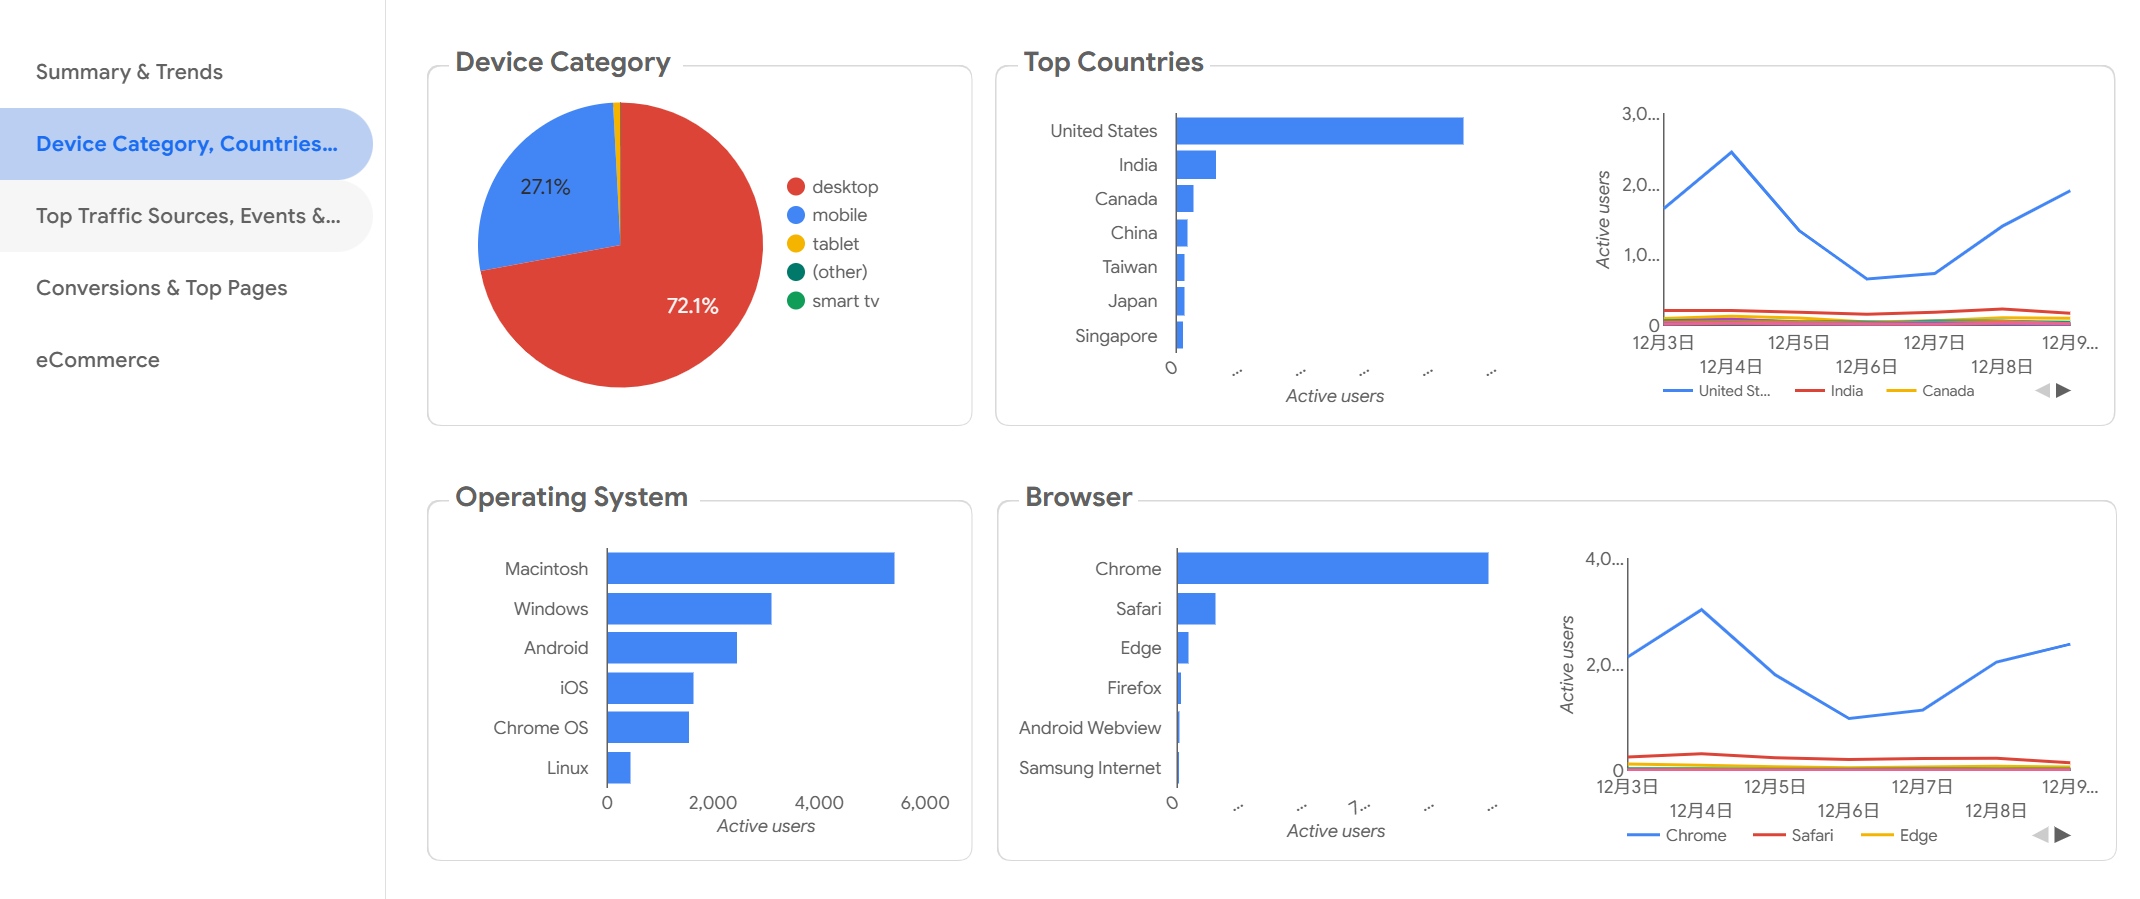
4. Looker Studio
One-sentence overview: Looker Studio is lightweight dashboard software designed for fast report creation, especially for marketing data and teams already working in the Google ecosystem.
 Key Features:
- Google Ads, GA4, Search Console, and Sheets connectors
- Web-based dashboard builder
- Shareable reports and embedding
- Real-time collaboration
- Community connector ecosystem
Pros & Cons:
- Pros:
- Easy to start with
- Strong fit for digital marketing reporting
- Good sharing and collaboration model
- Free entry point
- Cons:
- Governance and modeling depth are limited
- Performance can degrade with larger or more complex reports
- Connector quality varies
Best For (Target user/scenario):
- Marketing teams
- Agencies creating lightweight client dashboards
- Small businesses using Google tools
Pricing considerations:
- Low-cost entry makes it attractive, but complex enterprise reporting often requires additional tooling
5. Metabase
One-sentence overview: Metabase is open-source dashboard software that makes internal reporting and lightweight self-service analytics accessible for startups and lean teams.
 Key Features:
- No-code query builder and SQL editor
- Interactive dashboards and filters
- Self-hosted and cloud deployment
- Embedded analytics options
- Alerts and subscriptions
- Pros & Cons:
- Pros:
- Fast to deploy
- Open-source option lowers entry cost
- Friendly UI for business users
- Good balance of SQL and no-code workflows
- Cons:
- Less robust governance than enterprise BI tools
- Advanced customization can be limited
- Large-scale semantic consistency requires more process discipline
- Pros:
- Best For (Target user/scenario):
- Startups
- Internal business reporting
- Product teams needing quick dashboards without major overhead
- Pricing considerations:
- Open-source version is cost-effective; paid plans add governance and admin features
6. Apache Superset
One-sentence overview: Apache Superset is a SQL-first open-source dashboard platform built for technical teams that want full control and extensibility.
 Key Features:
- Open-source dashboards
- SQL Lab for query exploration
- Wide visualization support
- Role-based access options
- Extensible architecture
Pros & Cons:
- Pros:
- No license cost for core platform
- Highly customizable
- Strong for teams comfortable with engineering-led maintenance
- Cons:
- Setup and administration are heavier
- Less approachable for business users
- User experience is less polished than commercial BI tools
Best For (Target user/scenario):
- Engineering-led organizations
- Teams with in-house data infrastructure expertise
- Companies wanting customizable open-source dashboard software
Pricing considerations:
- Software is free, but implementation and maintenance costs are real
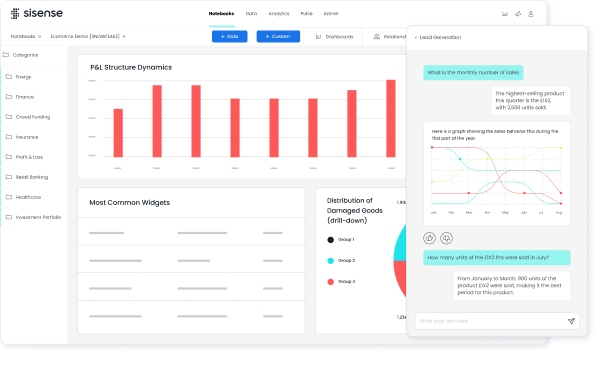
7. Sisense
One-sentence overview: Sisense is a dashboard and embedded analytics platform designed for companies that need to deliver analytics inside customer-facing applications.
 Key Features:
- Embedded and white-label dashboards
- API-driven customization
- Data mashups across sources
- Scalable cloud and hybrid deployment
- Security and multi-tenant support
Pros & Cons:
- Pros:
- Strong embedded analytics capabilities
- Flexible for product-led use cases
- Suitable for customer-facing reporting
- Cons:
- More complex than standard internal BI tools
- Pricing is often enterprise-oriented
- Can require technical resources for implementation
Best For (Target user/scenario):
- SaaS platforms
- Software companies embedding analytics in products
- Enterprises with customer portal reporting needs
Pricing considerations:
- Usually best justified when embedded analytics is a strategic requirement
8. Qlik Sense
One-sentence overview: Qlik Sense is dashboard software with associative analytics that helps users explore relationships across large and complex datasets.
 Key Features: Associative engine, self-service dashboards, AI insights, governed analytics, cloud and on-premises deployment
Pros & Cons:
- Pros: Flexible exploration, good enterprise features, strong data discovery
- Cons: Can require training, pricing may not suit smaller teams
Best For: Data-rich mid-market and enterprise organizations
9. Looker
One-sentence overview: Looker is a governed BI and dashboard platform built around semantic modeling and cloud data warehouse analytics.
 Key Features: LookML semantic layer, governed metrics, embedded analytics, cloud-native architecture
Pros & Cons:
- Pros: Strong governance, scalable modeling, works well with modern data stacks
- Cons: Implementation overhead, less ideal for teams without modeling expertise
Best For: Data-mature organizations with warehouse-first analytics
10. Domo
One-sentence overview: Domo is cloud-first dashboard software focused on operational visibility, data apps, and business-wide KPI access.
 Key Features: Real-time dashboards, broad connectors, collaboration tools, app ecosystem
Pros & Cons:
- Pros: Good for business visibility, strong cloud delivery, useful operational workflows
- Cons: Custom pricing, may be more than small teams need
Best For: Mid-size and enterprise operational reporting
11. Zoho Analytics
One-sentence overview: Zoho Analytics is affordable dashboard software for small and mid-size businesses that need quick deployment and broad business app connectivity.
 Key Features: Self-service reporting, AI assistant, prebuilt connectors, scheduled reporting
Pros & Cons:
- Pros: Budget-friendly, accessible UI, useful for SMBs
- Cons: Less depth than top enterprise BI platforms
Best For: SMBs and growing teams
12. Klipfolio
One-sentence overview: Klipfolio is KPI-focused dashboard software designed for performance tracking, agency reporting, and executive visibility.
 Key Features: KPI dashboards, custom metrics, cloud connectors, white-label options
Pros & Cons:
- Pros: Good for scorecards, useful for client reporting, relatively fast setup
- Cons: Less suited for deep analytics modeling
Best For: Agencies and SMB KPI tracking
13. Geckoboard
One-sentence overview: Geckoboard is simple dashboard software built for live KPI visibility on screens, team dashboards, and performance wallboards.
 Key Features: TV dashboards, KPI alerts, snapshots, easy metric display
Pros & Cons:
- Pros: Very easy to consume, ideal for visibility use cases
- Cons: Not a full BI platform
Best For: Support, sales, and operations teams tracking live KPIs
14. Databox
One-sentence overview: Databox is dashboard software for fast KPI reporting across sales, marketing, and executive use cases.
 Key Features: Templates, scorecards, mobile dashboards, data connectors
Pros & Cons:
- Pros: Quick onboarding, useful templates, strong for go-to-market reporting
- Cons: Limited depth for advanced BI needs
Best For: Small businesses and agencies
15. Grafana
One-sentence overview: Grafana is real-time dashboard software for monitoring systems, infrastructure, applications, and operational metrics.
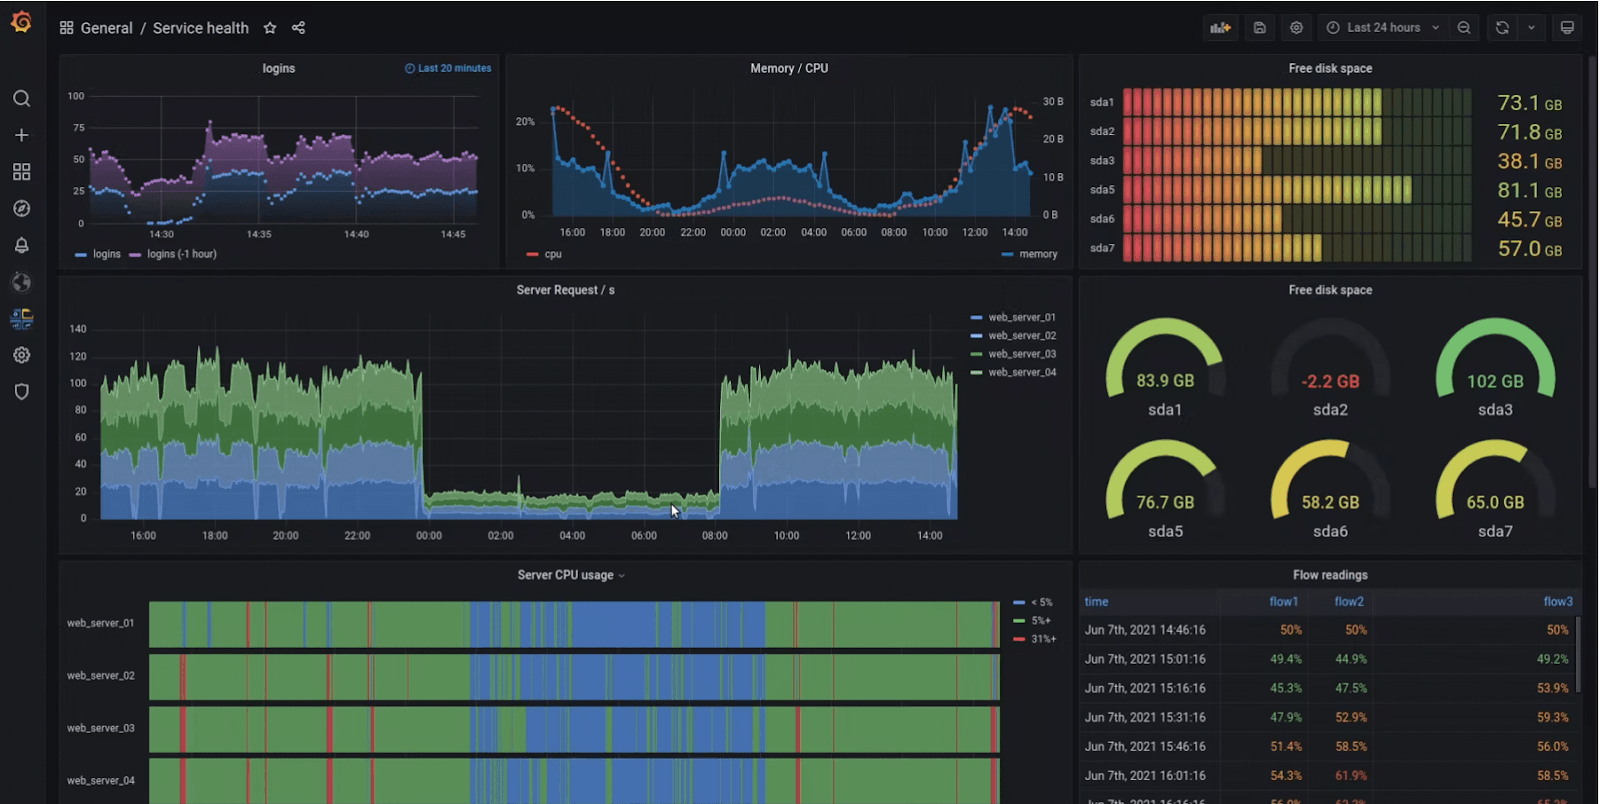 Key Features: Real-time visualization, alerting, observability integrations, open-source deployment
Pros & Cons:
Key Features: Real-time visualization, alerting, observability integrations, open-source deployment
Pros & Cons:
- Pros: Excellent for technical monitoring, strong ecosystem
- Cons: Less suitable for business-friendly executive BI
Best For: DevOps, IT, platform engineering, operations
16. ThoughtSpot
One-sentence overview: ThoughtSpot is search-driven dashboard software focused on self-service analytics through natural-language exploration.
 Key Features: Search-based analytics, AI insights, cloud warehouse integration
Pros & Cons:
- Pros: Strong self-service concept, good for ad hoc questions
- Cons: Fit depends on adoption model and data readiness
Best For: Enterprises pushing search-first analytics
17. Sigma
One-sentence overview: Sigma is cloud-native dashboard software that gives business users a spreadsheet-style interface on top of cloud data warehouses.
 Key Features: Spreadsheet UX, live warehouse queries, collaboration, governed reporting
Pros & Cons:
- Pros: Familiar for spreadsheet-heavy teams, strong warehouse alignment
- Cons: Best value depends on modern cloud data stack maturity
Best For: Data-driven companies using cloud warehouses
18. Mode
One-sentence overview: Mode is analyst-focused dashboard software that combines SQL, notebooks, and reporting for collaborative analytics workflows.
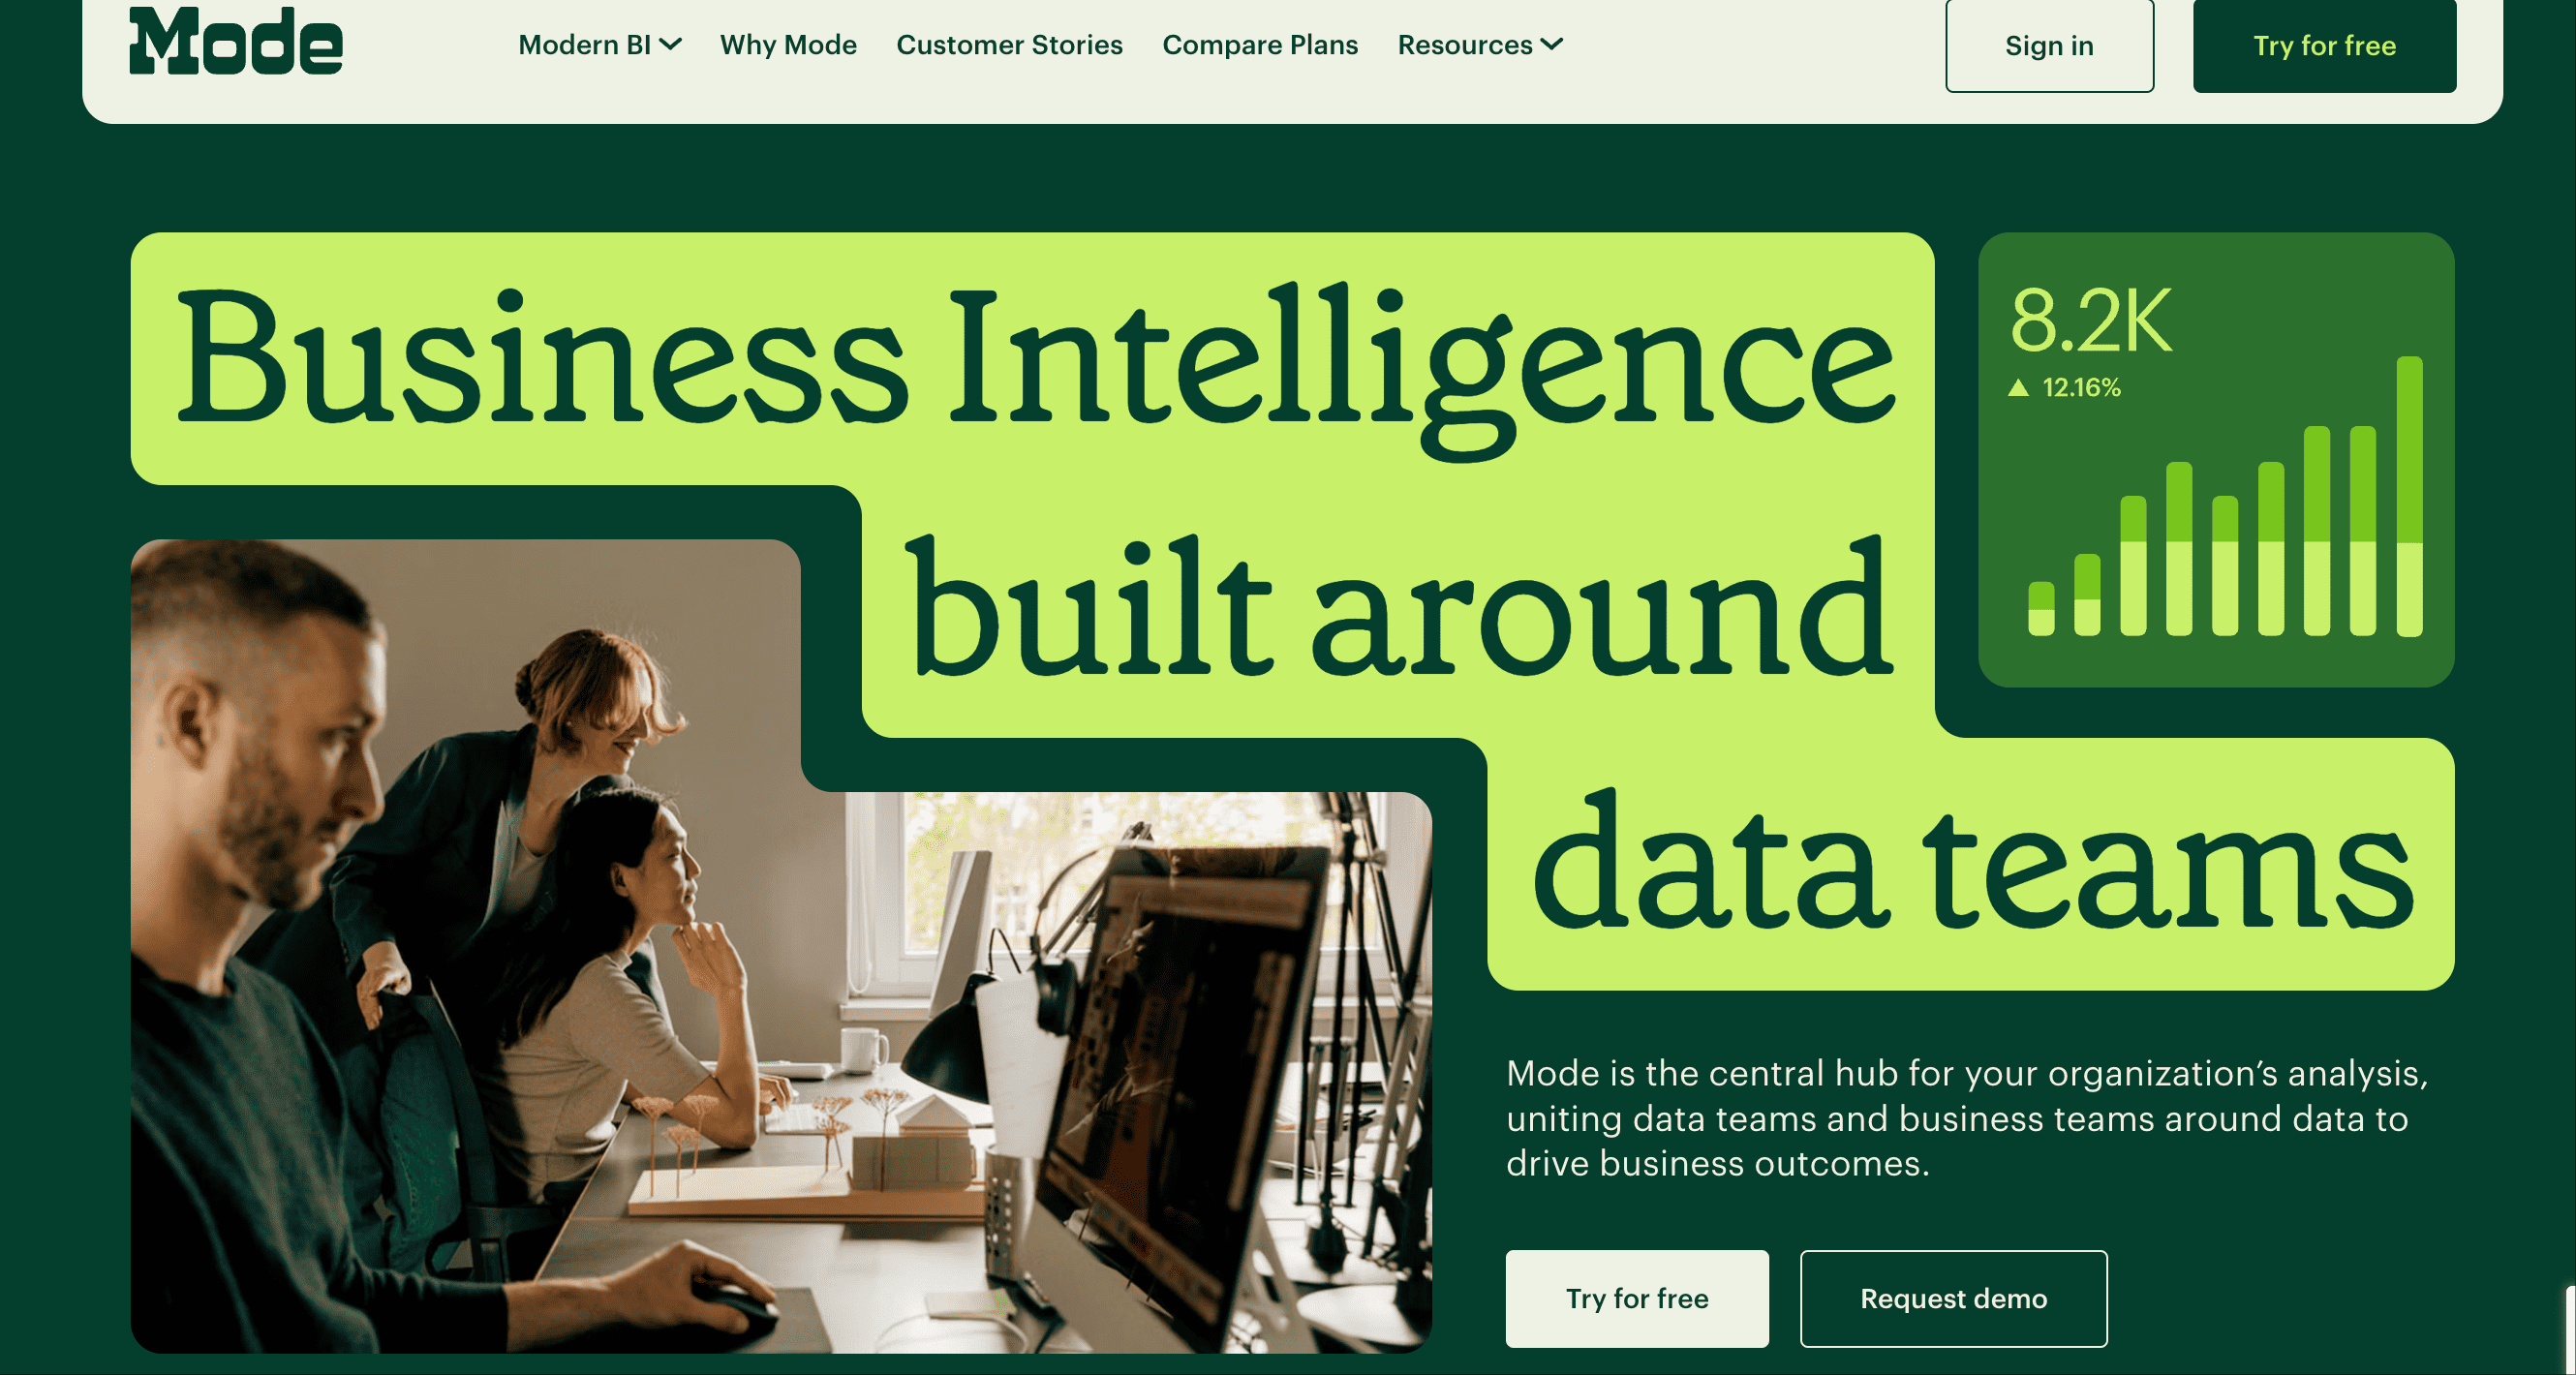 Key Features: SQL editor, notebooks, visual reports, team collaboration
Pros & Cons:
- Pros: Strong for analysts, flexible workflow
- Cons: Less intuitive for non-technical users
Best For: Analytics and data science teams
19. Redash
One-sentence overview: Redash is lightweight dashboard software for SQL-savvy teams that need simple reporting and alerting.
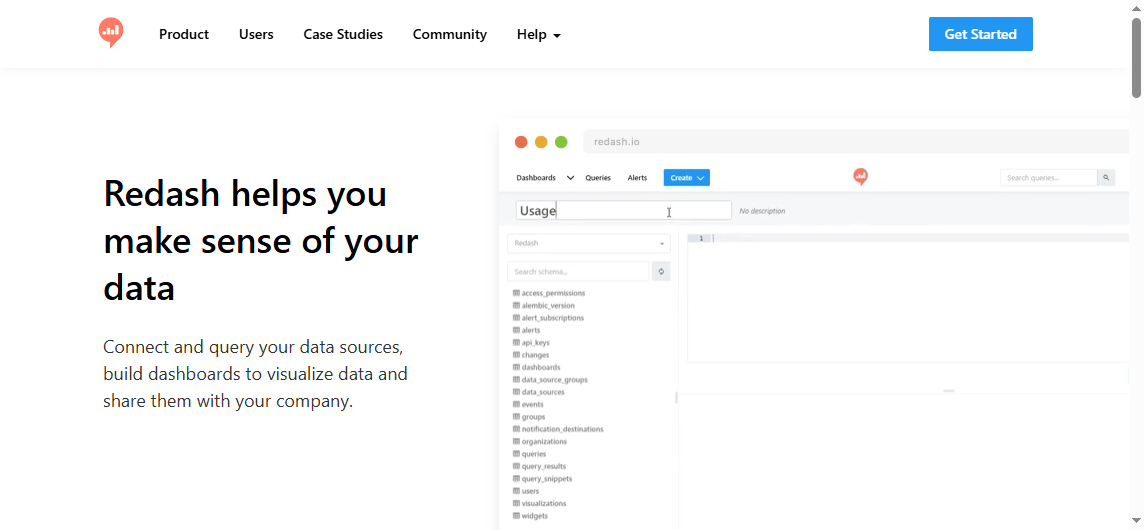 Key Features: Query editor, dashboards, visualizations, alerts
Pros & Cons:
- Pros: Simple and accessible for technical users
- Cons: Limited compared with modern full-featured BI tools
Best For: Small technical teams
20. AgencyAnalytics
One-sentence overview: AgencyAnalytics is dashboard software built specifically for marketing agencies delivering SEO, PPC, and client reporting.
 Key Features: Marketing connectors, client portals, white-label reports, scheduled delivery
Pros & Cons:
- Pros: Strong agency workflow support, client-friendly reports
- Cons: Narrower use case outside marketing
Best For: Agencies and marketing service providers
21. Kibana
One-sentence overview: Kibana is dashboard software for teams running analytics and observability workflows on Elasticsearch.
 Key Features: Elasticsearch visualizations, logs, security analytics, operational dashboards
Pros & Cons:
- Pros: Strong with Elastic environments, useful for monitoring and search analytics
- Cons: Limited as a general-purpose business dashboard tool
Best For: Elastic-centered technical teams
Best use cases by business type and team needs
The best dashboard software depends heavily on who will use it, how often dashboards need refreshing, and whether the goal is broad KPI visibility or deeper business intelligence.
Best dashboard software for startups
Startups typically need fast setup, low admin overhead, and enough flexibility to iterate as metrics evolve.
Best options:
- Metabase for low-cost internal dashboards
- Zoho Analytics for affordable business reporting
- Databox for sales and marketing KPI visibility
- FineBI for startups that want stronger scalability and governance from the beginning
Best dashboard software for SMBs
SMBs often need a practical balance of cost, usability, and room to grow.
Best options:
- FineBI
- Zoho Analytics
- Power BI
- Klipfolio
- Looker Studio
If your team needs dashboards for multiple departments and expects reporting complexity to increase, FineBI is often a better long-term choice than ultra-light dashboard tools.
Best dashboard software for agencies
Agencies usually care about connector breadth, client-friendly reports, recurring exports, and white-label options.
Best options:
- AgencyAnalytics
- Klipfolio
- Databox
- Looker Studio
Best dashboard software for ecommerce brands
Ecommerce teams need visibility into revenue, conversion rate, AOV, inventory, return rates, campaign efficiency, and channel performance.
Best options:
- FineBI
- Power BI
- Tableau
- Domo
- Looker Studio for lighter marketing-only views
Best dashboard software for enterprise operations teams
Enterprise operations teams usually need governance, permissions, scale, system integration, and formal reporting workflows.
Best options:
- Power BI
- Tableau
- Looker
- Qlik Sense
- FineBI
- Sisense for embedded or customer-facing needs
Best dashboard software by reporting function
Executive dashboards
Best options:
- FineBI
- Power BI
- Tableau
- Domo
These tools work well because they support summary KPIs, drill-down analysis, and cross-functional views.
Marketing analytics dashboards
Best options:
- Looker Studio
- AgencyAnalytics
- Databox
- Power BI
Sales reporting dashboards
Best options:
- Power BI
- FineBI
- Klipfolio
- Geckoboard
Finance tracking dashboards
Best options:
- Power BI
- Tableau
- FineBI
- Qlik Sense
Product and operational KPI dashboards
Best options:
- Metabase
- Grafana
- Superset
- FineBI
- Domo
Best dashboard software for small businesses and lean teams
Small businesses and lean teams need three things most: low friction, fast value, and easy sharing.
The strongest options are:
- Zoho Analytics for affordability
- Looker Studio for simple marketing dashboards
- Metabase for low-cost internal reporting
- Databox for KPI scorecards
- FineBI for businesses that want an all-in-one platform with more headroom
When an all-in-one reporting tool is better
An all-in-one dashboard software platform is a better choice when:
- You need multiple departments in one system
- You want less spreadsheet dependency
- You need role-based permissions
- You expect reporting requirements to become more complex
- You want consistent metrics across teams
That is where a tool like FineBI tends to outperform narrower dashboard products designed only for one department or one type of KPI wallboard.
Best dashboard software examples by reporting scenario
Below are common reporting scenarios and the tool types that usually fit best.
Executive summary dashboards
Effective executive dashboards should show:
- Revenue and margin trends
- Pipeline and forecast
- Customer growth and churn
- Operational exceptions
- Department-level performance summaries
Best tool types:
- Governed BI platforms such as FineBI, Power BI, and Tableau
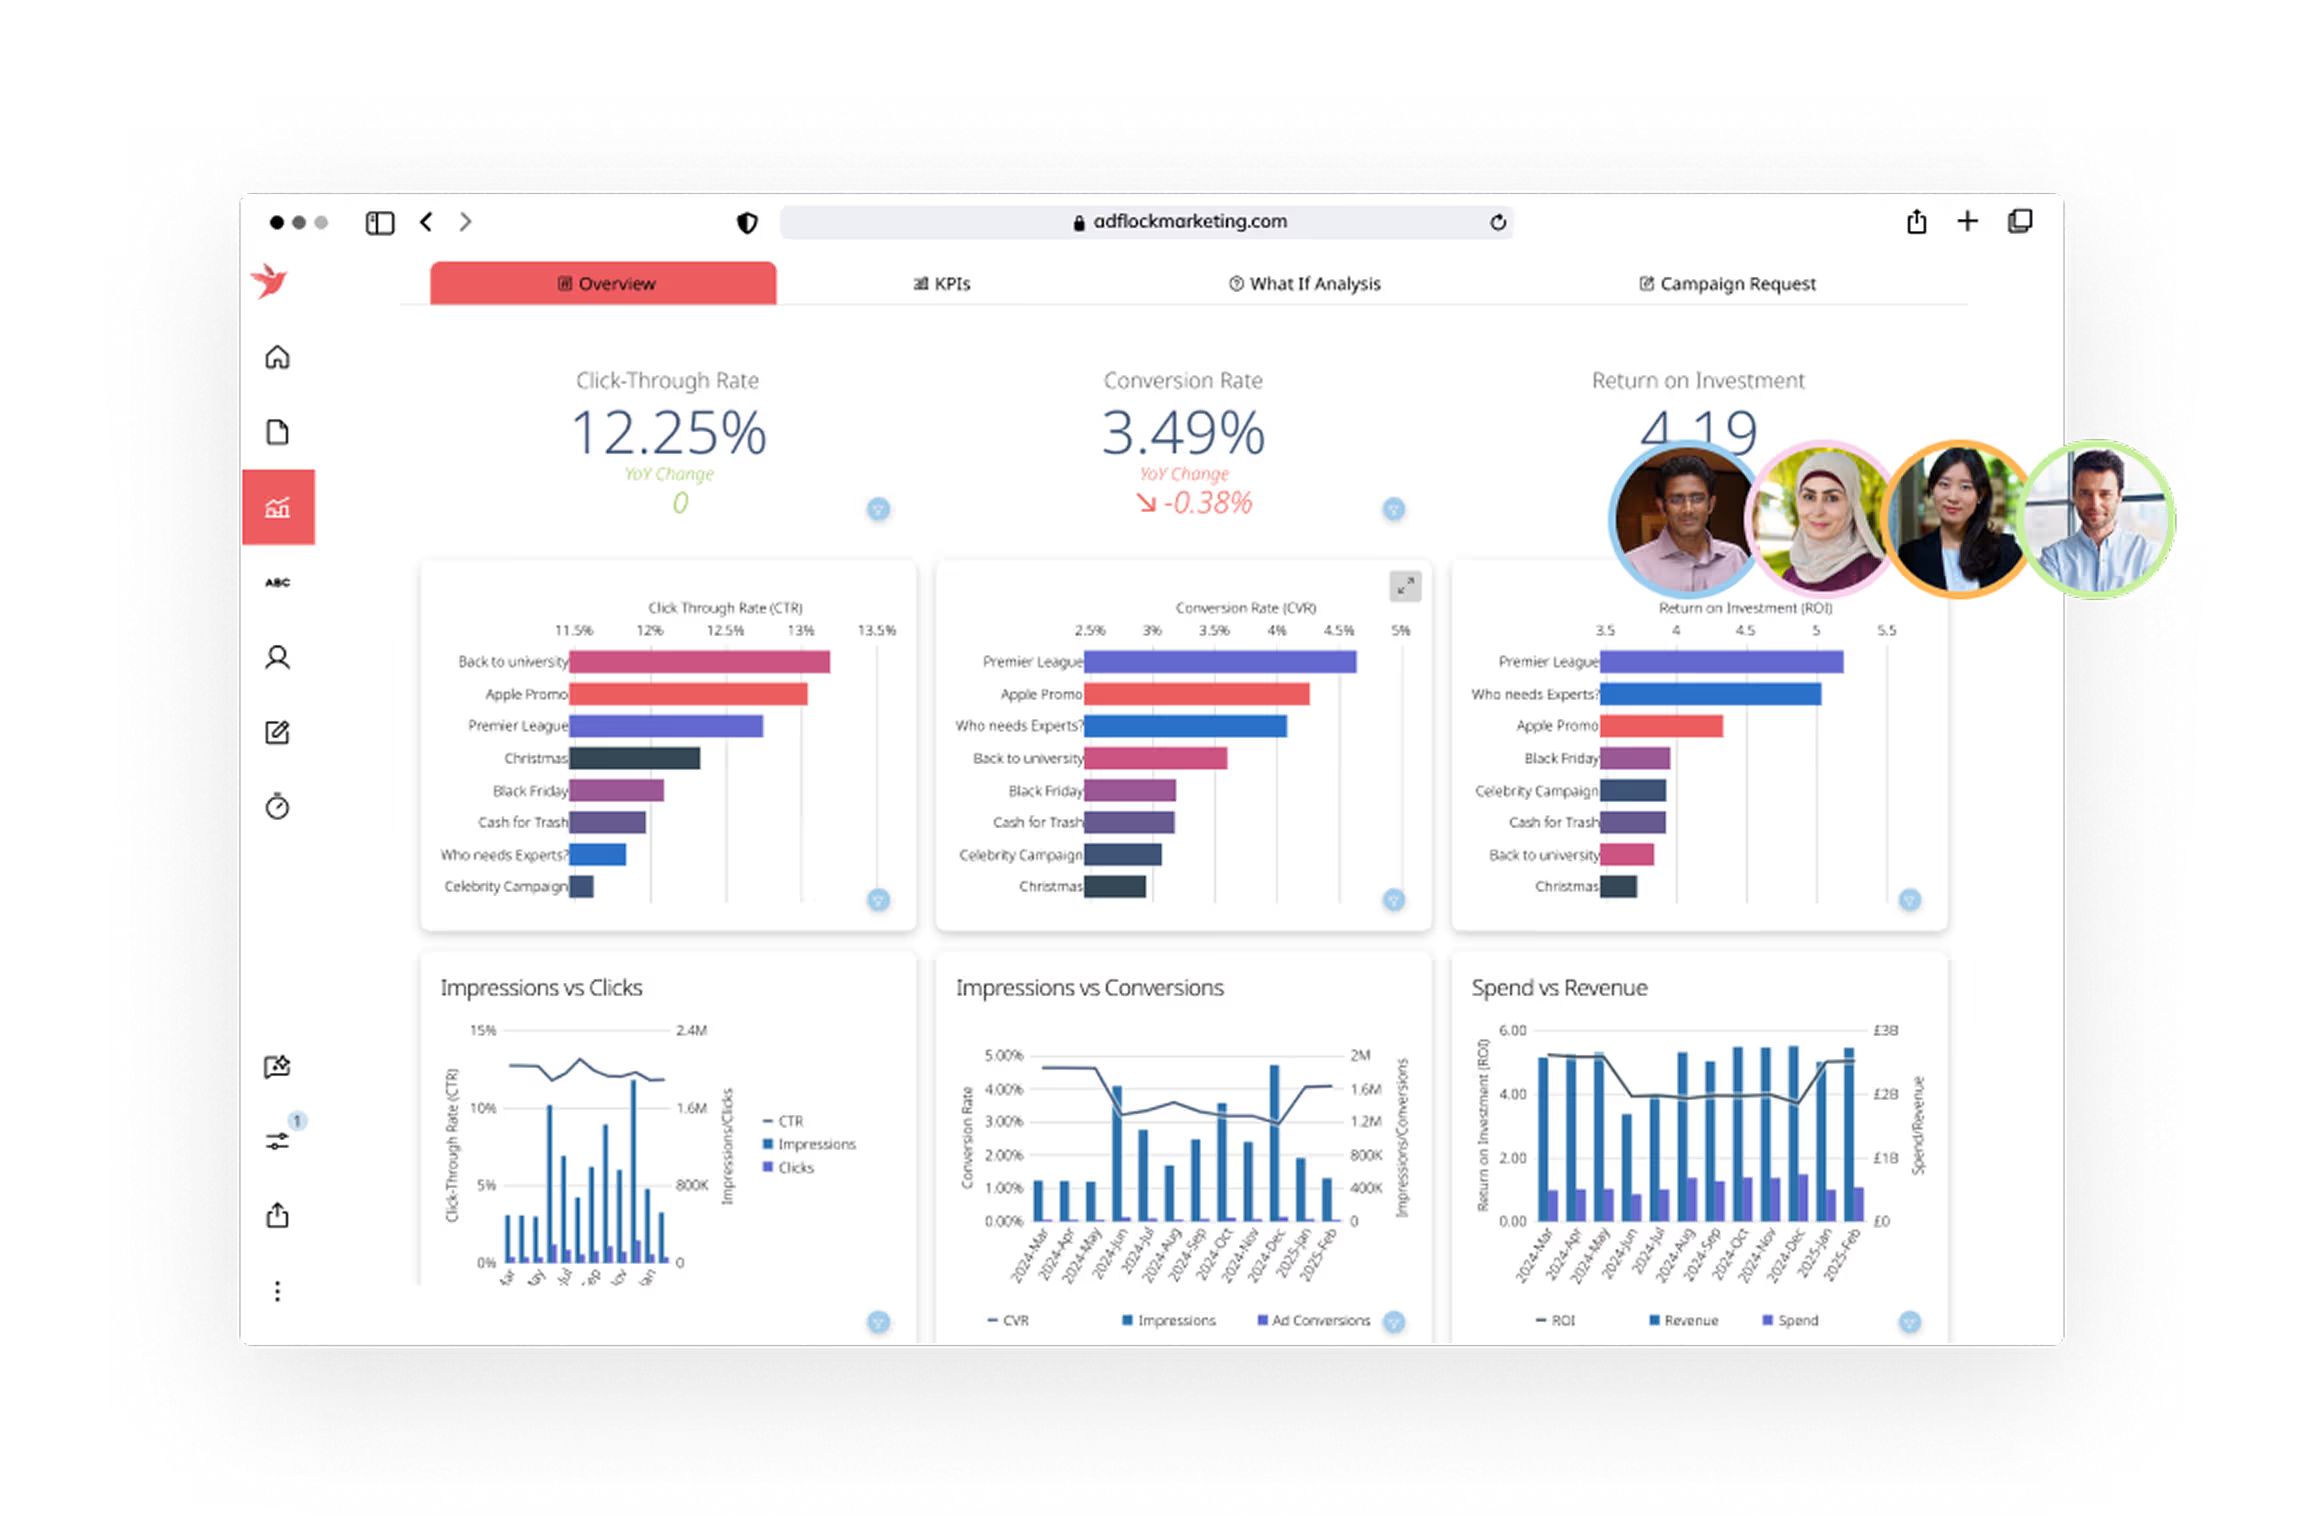
Campaign performance dashboards
Effective campaign dashboards should show:
- Spend by channel
- ROAS or ROI
- Conversion rate
- Lead quality
- CAC trends over time
Best tool types:
- Marketing-focused dashboard software such as Looker Studio, AgencyAnalytics, Databox, and Power BI
Pipeline dashboards
Effective pipeline dashboards should show:
- Opportunities by stage
- Conversion rates
- Rep performance
- Forecast attainment
- Sales cycle length
Best tool types:
- Power BI, FineBI, Klipfolio, and Geckoboard
Operations scorecards
Effective operations dashboards should show:
- SLA adherence
- Throughput
- Backlog
- Quality rates
- Exceptions requiring action
Best tool types:
- Domo, FineBI, Power BI, Grafana depending on business versus technical context
Final recommendations and how to make your shortlist
If you are comparing dashboard software in 2026, the smartest approach is to shortlist by business fit instead of popularity alone.
Top picks by category
- Best overall dashboard software: FineBI
- Best for enterprise BI: Microsoft Power BI
- Best for advanced visual analytics: Tableau
- Best for marketing teams: Looker Studio
- Best value for growing businesses: FineBI or Zoho Analytics
- Best open-source option: Metabase
- Best for embedded analytics: Sisense
- Best for KPI wallboards: Geckoboard
- Best for technical monitoring: Grafana
A simple framework to compare finalists
Use this side-by-side decision framework:
- Business fit
- Does the tool match your reporting maturity and team skill level?
- Data fit
- Can it connect cleanly to your actual systems and refresh at the speed you need?
- User fit
- Can executives, managers, and analysts all use it effectively?
- Governance fit
- Can you manage permissions and metric consistency as adoption grows?
- Cost fit
- What is the total cost over 12 to 24 months, not just the entry plan?
- Scalability fit
- Will you still want this tool after dashboards expand across departments?
Recommended shortlist by buyer type
- If you are a small business: FineBI, Zoho Analytics, Looker Studio
- If you are a Microsoft-centric company: Power BI, FineBI
- If you need best-in-class visual analysis: Tableau, Power BI
- If you need governed self-service dashboards: FineBI, Looker, Power BI
- If you need open-source flexibility: Metabase, Superset
- If you need embedded product analytics: Sisense, Metabase
Next steps for trials and implementation planning
Before making a final purchase decision:
- Choose 2 to 4 shortlisted tools
- Rebuild one real dashboard in each platform
- Test with actual users, not just analysts
- Validate permissions and data refresh behavior
- Compare implementation effort, not just feature lists
- Estimate total ownership cost for year one and year two
If your goal is to balance usability, scalability, and governed self-service analytics, FineBI deserves a place on your shortlist. It is especially well suited for organizations that want dashboard software capable of serving both business users and data teams without the complexity gap that often appears between lightweight reporting tools and enterprise BI platforms.


